Grow Light Spectrometer Guide: What a Spectral Reading Shows
The short answer
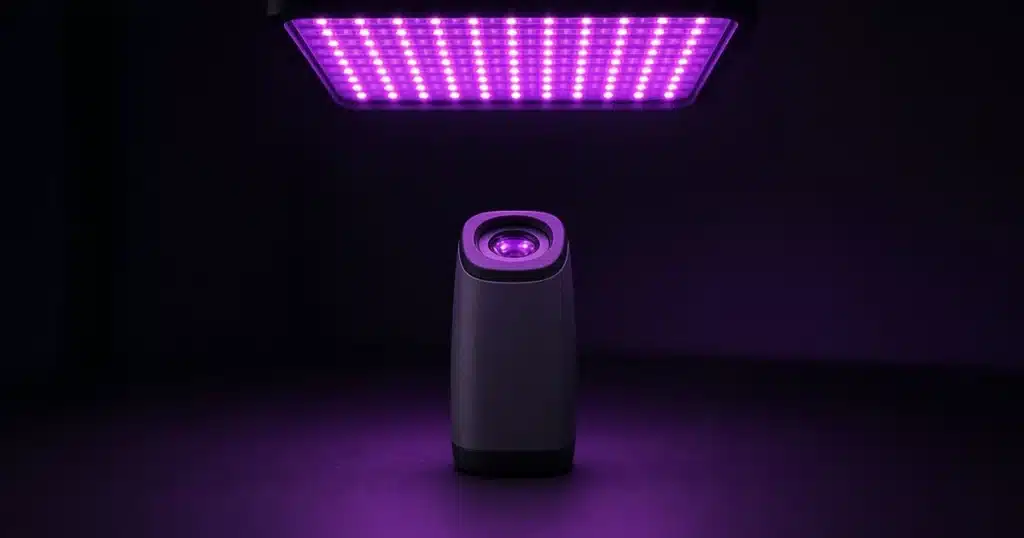
A grow light spectrometer, also called a spectroradiometer, shows how a light’s output is spread across wavelengths, from blue through red and into far red. It resolves the narrow peaks of LED fixtures that simple sensors can misread. For routine checks a quantum sensor is enough, but a spectral reading helps verify maker claims or compare fixtures.
Most growers never need one. When you do, it answers questions no other meter can.
What does a spectrometer measure?
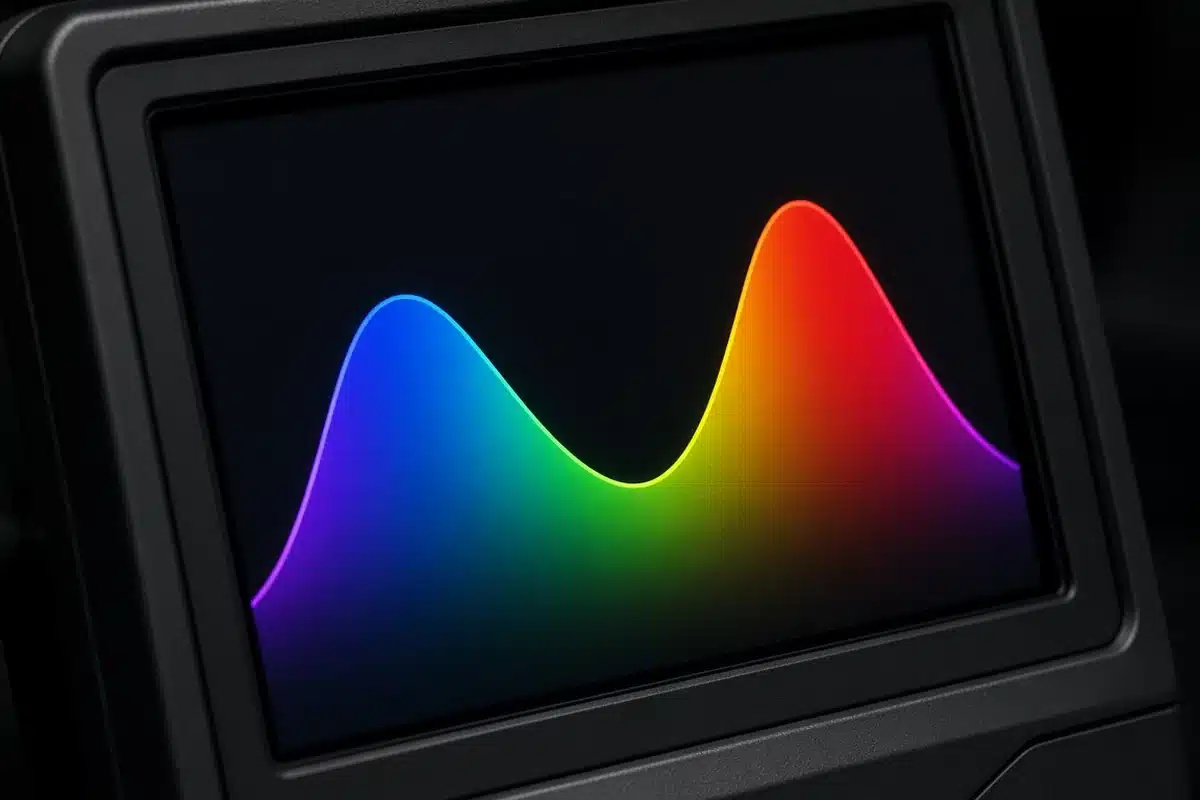
A spectrometer splits light into its wavelengths and measures how much energy or how many photons arrive at each one. The result is a chart with wavelength running along the bottom, from short violet and blue on the left to long red and far red on the right. The height of the line shows how much light sits at each point.
A white LED shows a tall, narrow blue peak and a wide hump across green, yellow and red. A red and blue fixture shows two sharp peaks with little in between. A fixture with far red diodes shows an extra bump past 700 nanometers.
The University of Missouri Extension guide to grow lights explains how different wavelengths affect plants. Blue light shapes compact growth. Red light drives photosynthesis well. Far red affects stretching and, in some plants, flowering.
How is it different from a quantum sensor?
A quantum sensor adds up every photon between 400 and 700 nanometers into one number, PPFD. It tells you how much plant light there is, not what colors make it up.
A spectrometer shows the full breakdown. It can show light outside the PAR band, such as UV and far red, which a quantum sensor ignores.
| Band | What it shows | Notes |
|---|---|---|
| Blue, about 400 to 500 nm | Share of light that shapes compact growth | High in white and cool LEDs |
| Green, about 500 to 600 nm | Light that reaches deeper into leaves | Large share in white LEDs |
| Red, about 600 to 700 nm | Main driver of photosynthesis | Peaks near 660 nm in many LEDs |
| Far red, about 700 to 800 nm | Light that affects stretch and flowering | Outside PAR, not counted by standard quantum sensors |
Sources: University of Missouri Extension, Resource Innovation Institute.
When do you need a spectral reading?
Most growers buy fixtures based on maker spectral charts. A spectrometer lets you check those charts against what the light produces.
It’s useful when comparing two fixtures that claim similar output. It helps when an older fixture seems to grow plants differently than it once did. Diodes age, and some colors fade faster than others.
The Resource Innovation Institute lighting best practices guide encourages growers to check light at the canopy and compare fixtures with consistent methods. Spectral data is one part of it.
Our post on how light wavelengths affect cannabinoid production covers why some growers pay close attention to spectrum. For the basics of how plants use light, see the process of light to energy in cannabis.
Which units should you use?
Spectrometers can show results in energy units, watts per square meter per nanometer, or in photon units, micromoles per square meter per second per nanometer.
Plants respond to photons, so photon units are the better choice for grow lights. Energy units make blue look larger and red look smaller than they are in plant terms, because blue photons carry more energy each.
Check which unit your meter uses before comparing to a maker chart. Many confusing results come from mixing the two.
What do home grade spectrometers offer?
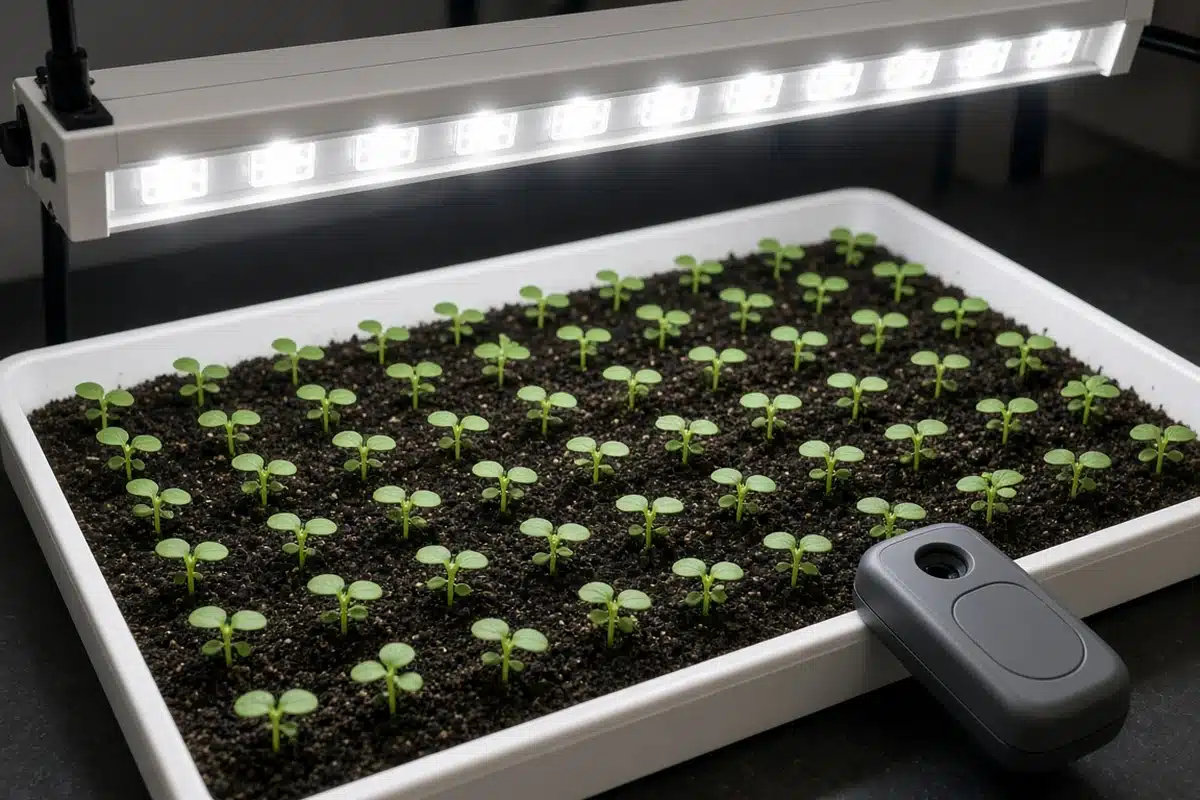
Lab spectroradiometers are expensive. Handheld units built for horticulture cost less and are accurate enough for comparing fixtures.
Some handheld meters combine a spectrometer and a PPFD reading. They show the chart and the total plant light in one step. That makes them handy for growers who want both.
Phone attachments and apps exist but vary widely. Use their charts as rough guides only.
How do you read a spectral chart?
Look first at the overall shape. A broad curve from blue to red suggests a white fixture. Separate sharp spikes suggest colored diodes.
Then compare shares. How much of the total sits in blue, in red and in far red? Many meters calculate these ratios for you.
Finally, compare the chart with the maker’s chart. Small differences are normal. A missing peak or a big shift is worth a question to the maker. For fixture choice, see choose the right LED lights for your cannabis grow.
How to: step by step
- Decide what you need to verify.
- Use a spectroradiometer rated for plant light.
- Measure at canopy height.
- Save the spectral chart for each fixture.
- Compare blue, red and far red shares.
- Use a quantum sensor for routine intensity checks.
Hold the meter level and hold your shadow off the sensor.
Measure each fixture at the same height so the charts compare fairly.
Troubleshooting
Readings differ from spec sheet. Height or angle differs. Match the maker’s setup.
Noisy chart? Light is low. Measure closer to the fixture.
Confusing results. The units are wrong. Use photon units.
Far red missing. The fixture has no far red diodes. Check the spec sheet.
Charts change between visits. Diodes are aging. Compare against your first saved chart.
A spectral reading is a check, not a daily tool, so save charts and compare them over time. Kind Seed Co carries cannabis seeds for growers fine tuning their light.
Sources
- Lighting for controlled environment agriculture, best practices guide, Resource Innovation Institute, Lighting for controlled environment agriculture
- Controlled environment agriculture: understanding grow lights (G6987), University of Missouri Extension, Controlled environment agriculture
FAQ
Do home growers need a spectrometer?
Most do not. A quantum sensor covers routine checks. A spectrometer helps when comparing fixtures or checking maker claims.
Can a phone measure spectrum?
Only roughly. Phone add ons and apps vary a lot. Use them as a general guide.
What is far red?
Light just past visible red, about 700 to 800 nm. It affects stretch and flowering responses.
Does spectrum matter more than intensity?
Intensity usually matters more for growth. Spectrum shapes how plants grow and develop.
Do LEDs change spectrum as they age?
Yes, slowly. Some colors fade faster. Saved charts let you see the change.