
PPM for Cannabis: EC, TDS and the 500 vs 700 Scale
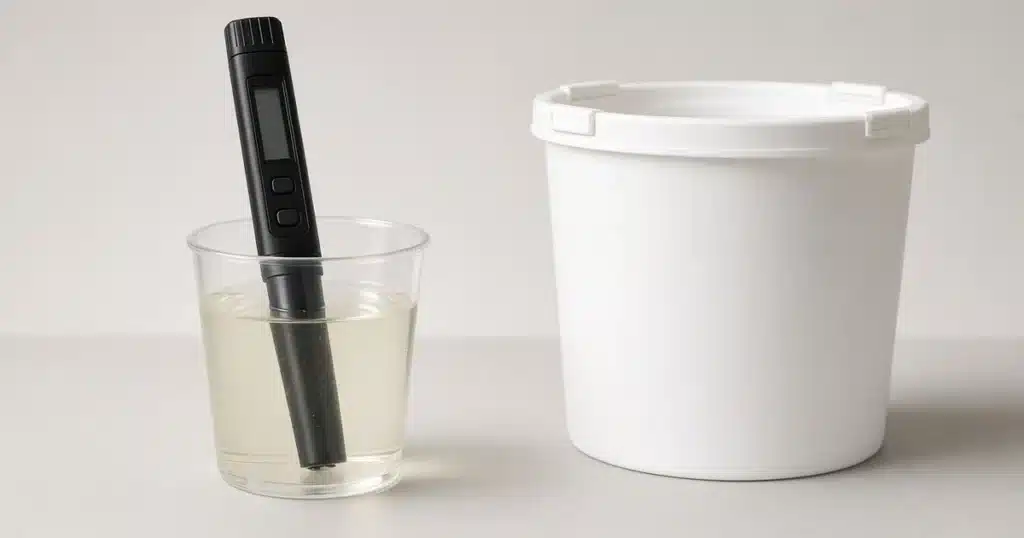
PPM for cannabis is an estimate of dissolved nutrients made from an EC reading. The meter measures electrical conductivity (EC), then multiplies it by a conversion factor to show ppm. Different meters use different factors, so the same nutrient mix can read 500 ppm on one pen and 700 ppm on another. University of Georgia Extension notes the factor can vary between 640 and 700 depending on which fertilizer salts are in the water, and calls any ppm figure a broad approximation. Many meters use a 500 or 700 scale, a setting chosen by the meter maker, and some let you switch between the two. Always match the scale your feeding chart uses.
How do EC and ppm relate?
EC is usually shown in millisiemens per centimeter (mS/cm). One mS/cm equals 1 dS/m and 1,000 µS/cm, so those units are the same scale written three ways, per University of Maryland Extension. Ppm is EC times a factor.
North Dakota State University Extension adds two unit notes worth knowing. TDS in milligrams per liter is the same as ppm, and some meters show parts per thousand (ppt), where 1 ppt equals 1,000 ppm. A pen reading 1.2 on a ppt display is showing 1,200 ppm. Many meters can also switch modes between EC, TDS and salinity, so check which mode is on before you write a number down.
| EC (mS/cm) | ppm, 500 scale | ppm, 640 scale | ppm, 700 scale |
|---|---|---|---|
| 0.5 | 250 | 320 | 350 |
| 1.0 | 500 | 640 | 700 |
| 1.5 | 750 | 960 | 1,050 |
| 2.0 | 1,000 | 1,280 | 1,400 |
| 2.5 | 1,250 | 1,600 | 1,750 |
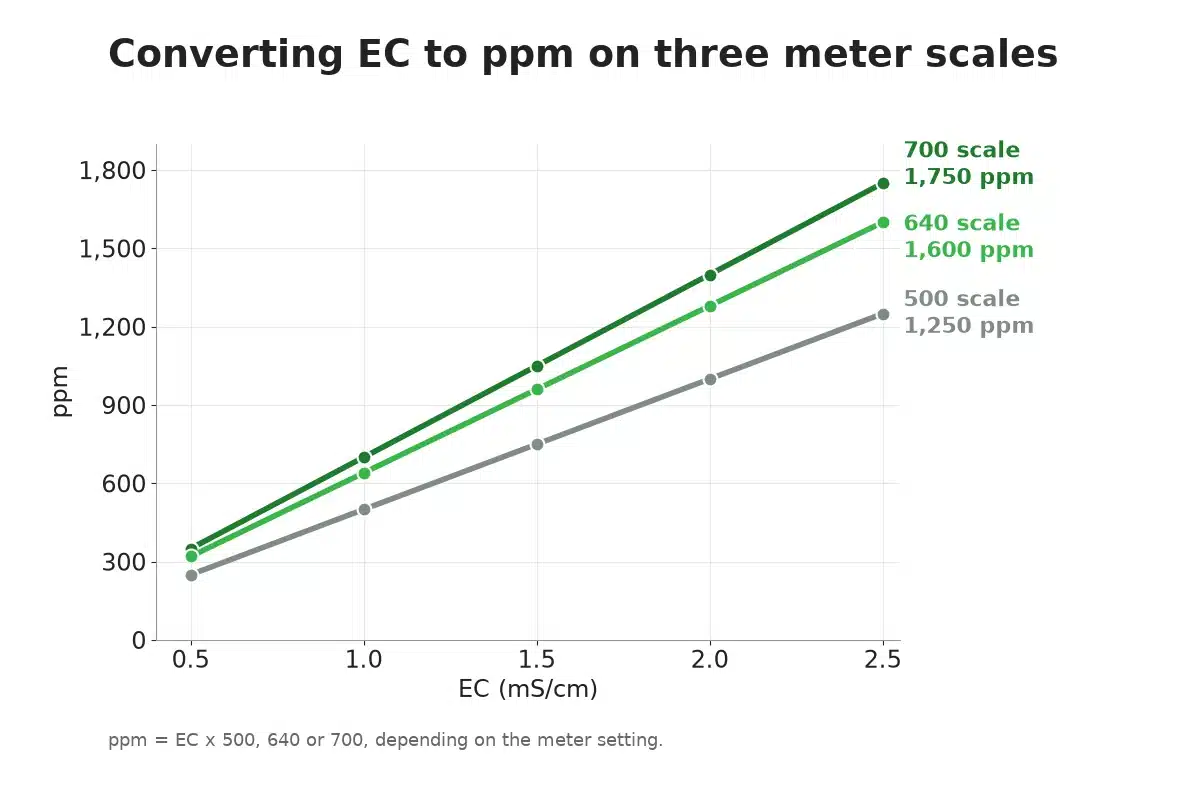
Conversion: ppm = EC x factor. University of Georgia Extension uses 670 as a working average and gives 640 to 700 as the range. The 500 and 700 scales are meter-maker settings rather than extension figures.
The gap grows as EC rises. At EC 2.0, the 500 scale reads 1,000 ppm while the 700 scale reads 1,400 ppm. It is the same nutrient mix, shown two ways.
Why is EC more reliable than ppm?
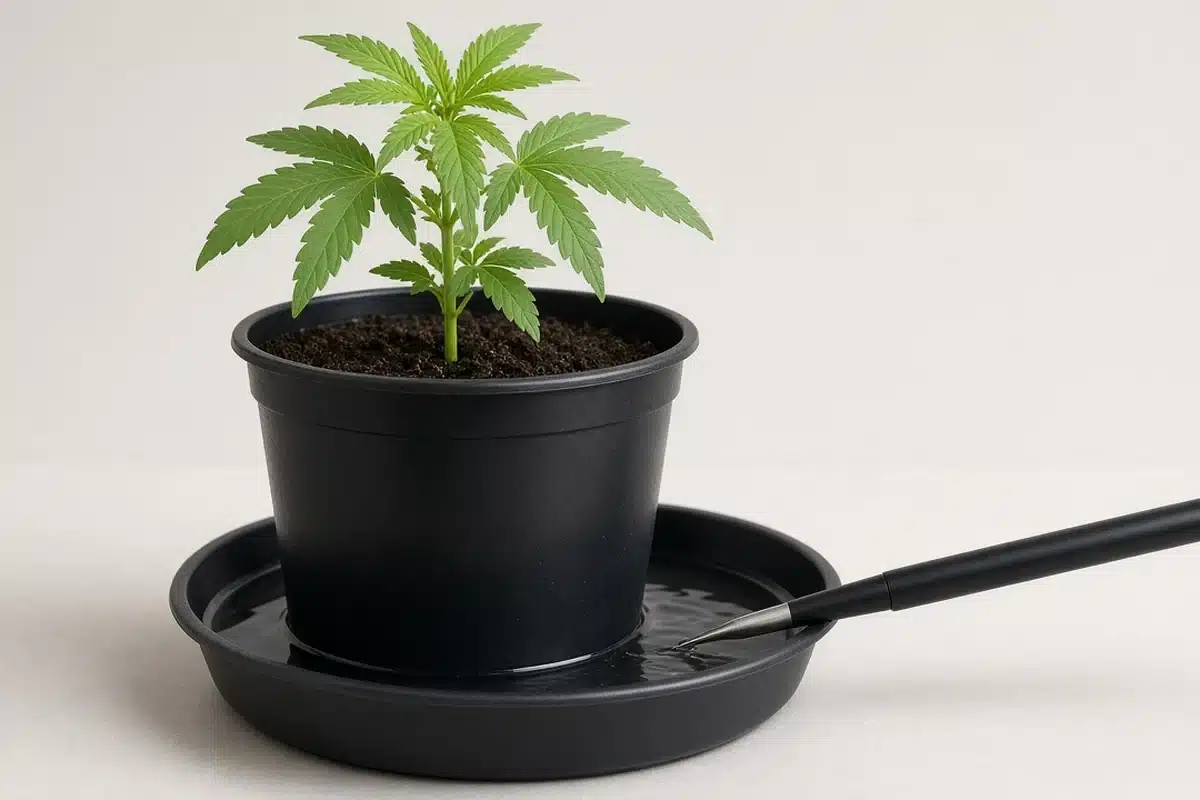
EC is what the meter actually measures. Ppm is a calculated estimate that depends on the factor. North Dakota State University Extension adds another wrinkle: in natural water, the true ratio between TDS and EC climbs as water gets saltier, from about 0.50 at 0.1 mS/cm to about 0.65 at 1.0 mS/cm and about 0.72 at 2.0 mS/cm. A fixed factor cannot track that, which is why University of Georgia Extension calls mS/cm the preferred way to report EC.
Logging EC makes it easier to compare your numbers with charts and with other growers, since everyone is reading the same thing.
How do you convert between the 500 and 700 scales?
You cannot jump straight from one ppm scale to the other. Go through EC.
- Divide your ppm reading by your meter’s factor to get EC. For example, 1,100 ppm on a 500 meter is 1,100 / 500 = 2.2 mS/cm.
- Multiply that EC by the chart’s factor. For a 700 chart, 2.2 x 700 = 1,540 ppm.
- Compare that number with the chart.
To find an unknown factor, read the same solution in ppm and in EC mode, then divide ppm by EC. A result near 500 means a 500 meter, near 700 means a 700 meter.
How do you measure correctly, step by step?
- Check the meter in its calibration standard solution before a session. Rinse the probe after.
- Let the solution reach room temperature, or use a meter with automatic temperature compensation, since EC changes with temperature.
- Measure your plain water first and write it down.
- Add nutrients one part at a time, stir well, then measure again.
- Set pH last, then take a final reading. That number matches what goes to the plants.
- Record which scale the reading uses.
Measuring plain water first matters. University of Georgia Extension advises testing plain irrigation water and subtracting it from the fertilized reading to find what the fertilizer added. If your water reads 0.5 mS/cm and the mix reads 1.7, the nutrients account for 1.2.
When should you check the meter itself?
A meter that drifts can throw off every reading that follows. North Dakota State University Extension advises checking an EC meter against a calibration solution before sampling, and calibrating again whenever the batteries are changed or the meter has been dropped on a hard surface. A maker-supplied standard solution is the first choice.
If you run out, the same extension page gives a home check for meters used on water. Level off 1/4 teaspoon of table salt, add it to 4 cups of distilled water, stir until it dissolves and let it rest about 5 minutes. That mix lands near 1.8 grams of salt per liter and reads about 3,200 to 3,600 µS/cm depending on the salt. With the meter set to TDS and a factor of 0.76, it should read roughly 2,400 to 2,700 ppm. A reading far outside that range means the meter needs attention before you trust it with a reservoir. Make a fresh mix each time you check, as the extension page advises.
Can an EC reading tell you how much nitrogen you added?
Only roughly, and only for a freshly mixed solution. Purdue Extension shows how greenhouse growers do it with the fertilizer label. Many bags list the EC of that fertilizer when mixed to 100 ppm nitrogen. The formula is ppm N = 100 x (EC of the mix minus EC of the plain water) / EC of the mix at 100 ppm N.
In Purdue’s example, the water reads 0.5, the finished mix reads 2.5, and the label says 100 ppm N reads 0.59. That works out to 100 x 2.0 / 0.59, or about 339 ppm N. Purdue limits the method to freshly prepared fertilizer solution, so it is not meant for a reservoir that plants have been feeding from. University of Maryland Extension makes the same point from the other side: EC counts every salt together, so a high reading could be nitrates or sodium and the meter cannot tell which.
The type of salt changes the reading too. A University of Georgia Extension table of single fertilizer salts, measured in distilled water, shows the gap. At 100 ppm nitrogen, ammonium nitrate reads 0.46 mS/cm, while potassium nitrate reads 0.95 mS/cm. That is the same amount of nitrogen at roughly double the EC. Two mixes with matching meter readings can carry quite different amounts of each nutrient, so compare readings only within the same nutrient line.
How do you read runoff and the root zone?
The solution in the jug is only half the picture. What sits around the roots can drift higher as water leaves and salts stay behind. For pots and small containers, University of Maryland Extension points growers to the pour-through method, which tests the liquid that drains out of the container.
| Pour-through EC (mS/cm) | General reading for container media |
|---|---|
| Under 0.5 | Low, acceptable for all crops including seedlings |
| 0.5 to 2.5 | Normal, very salt-sensitive crops may lose some yield |
| 2.5 to 3.5 | Moderately high, salt-sensitive seedlings may be injured |
| Over 3.5 | Extreme, most crop roots damaged and yield lost |
Source: University of Maryland Extension, Salinity Matters for High Tunnels and Growing Media (general horticulture, not cannabis-specific).
Use the table to spot a trend, not to set feeding targets. For feeding plans, see the Kind Seed Co feeding schedule in soil and the hydroponic feeding schedule. For collecting and reading drainage, see cannabis runoff.
What changes by stage?
Seedlings and clones. Young roots are sensitive to salts. University of Maryland Extension rates the low range as acceptable for seedlings and warns that seedlings are the first to suffer as EC climbs. Begin with a light mix and confirm with your meter before each feed.
Vegetative growth. Plants take up more as they grow, so readings in the reservoir tend to drift. Measure daily in hydro and at each feed in soil, and log the trend.
Flowering. Many feeding charts change strength in flower. That is when scale mix-ups do the most harm, because a chart written on one scale and a meter on another can be hundreds of ppm apart.
Late flower. As feeding tapers, keep checking runoff. A rising runoff reading while you feed less points to salt left in the medium.
What causes wrong readings, and how do you fix them?
| Symptom | Likely cause | Fix |
|---|---|---|
| Same mix reads differently on two meters | Different conversion factors | Compare in EC, or set both to the same factor |
| Reading drifts over weeks | Meter out of calibration or dirty probe | Clean the probe, recheck in standard solution |
| Plain water already reads high | Minerals in the source water | Note the baseline and subtract it |
| Runoff far higher than input | Salt buildup in the medium | Water with plain water to some runoff, then retest |
| Numbers jump between readings | Unstirred or cold solution | Stir well, let it warm, read again |
Based on common grower practice and the extension sources listed.
What are common mistakes?
- Following a 700-scale chart with a 500-scale meter, which pushes the mix far stronger than intended.
- Skipping the plain-water reading, then blaming nutrients for minerals the water already carried.
- Reading before stirring, or before pH is set.
- Never checking the meter in calibration solution.
- Judging one runoff reading instead of a trend over several waterings.
- Posting ppm without the factor, which leaves other growers guessing.
Put a small label on your meter that names its scale, a simple way to avoid scale mix-ups.
Sources
- University of Georgia Cooperative Extension. Conversion Tables, Formulas, and Suggested Guidelines for Horticultural Use (B 931). https://fieldreport.caes.uga.edu/wp-content/uploads/2025/08/B-931_6.pdf
- North Dakota State University Extension. Using Electrical Conductivity and Total Dissolved Solids Meters to Field Test Water Quality. https://www.ndsu.edu/agriculture/extension/publications/using-electrical-conductivity-and-total-dissolved-solids-meters-field-test
- University of Maryland Extension. Salinity Matters for High Tunnels and Growing Media. https://extension.umd.edu/sites/extension.umd.edu/files/publications/Salinity%20Matters%20for%20High%20Tunnels%20and%20Growing%20Media%20(3).pdf
- Purdue University Extension. Details of Electrical Conductivity Measurements in Greenhouse Production (HO-286-W, K. Nemali). https://www.extension.purdue.edu/extmedia/HO/HO-286-W.pdf
- Meter-setting reference (maker, not extension): Hanna Instruments HI9814 datasheet, selectable 0.5 or 0.7 EC to TDS factor. https://www.itm.com/pdfs/cache/www.itm.com/hi-9814/datasheet/hi-9814-datasheet.pdf
FAQ
What is the difference between the 500 and 700 ppm scales?
Both turn the same EC reading into ppm with a different factor. The 500 scale multiplies EC by 500, and the 700 scale multiplies by 700. An EC of 1.0 reads 500 ppm on one and 700 ppm on the other. Check which one your meter and chart use.
Is a TDS meter the same as an EC meter?
Most TDS meters measure EC and convert it to ppm with a built-in factor. Some let you choose the factor. If your meter can show EC directly, that number is easier to compare with charts and other growers. If it only shows ppm, find out its factor first.
Why does my runoff ppm read higher than my input?
Higher runoff often means salts are building up in the growing medium. Plants take up water and leave some minerals behind. Watering with plain water to a bit of runoff can help. Compare runoff with input over several waterings rather than judging one reading.
Should I measure ppm before or after adding pH adjusters?
Measure after adding nutrients, then adjust pH and check again. pH adjusters change the reading slightly. Most growers mix nutrients first, then set pH, then take a final reading. That last number is the one to write down, since it matches what goes to the plants.


